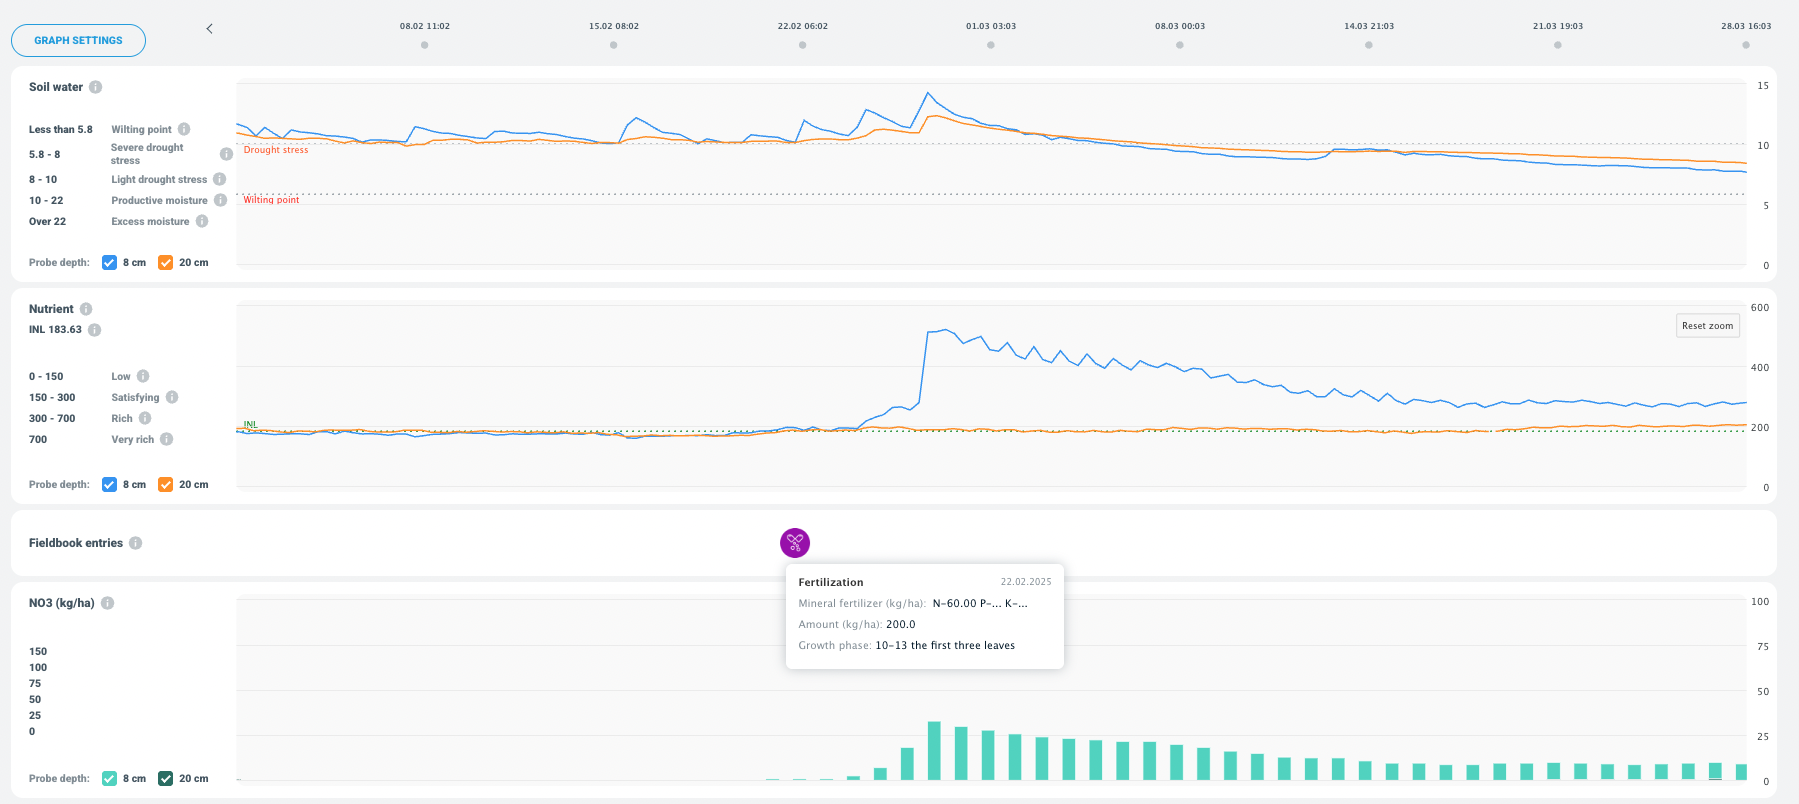
The graph view helps to understand how what’s happening in the field changes over time. It brings together the most important field measurements into a single view, where each parameter is displayed as a separate graph on a shared timeline. This makes it possible to see how different factors evolve over time and how they influence one another.
Users can choose which graphs to display and in what order. This allows them to focus on the information that matters most at any given moment – whether that’s soil water, nutrient dynamics, rainfall, or temperatures.
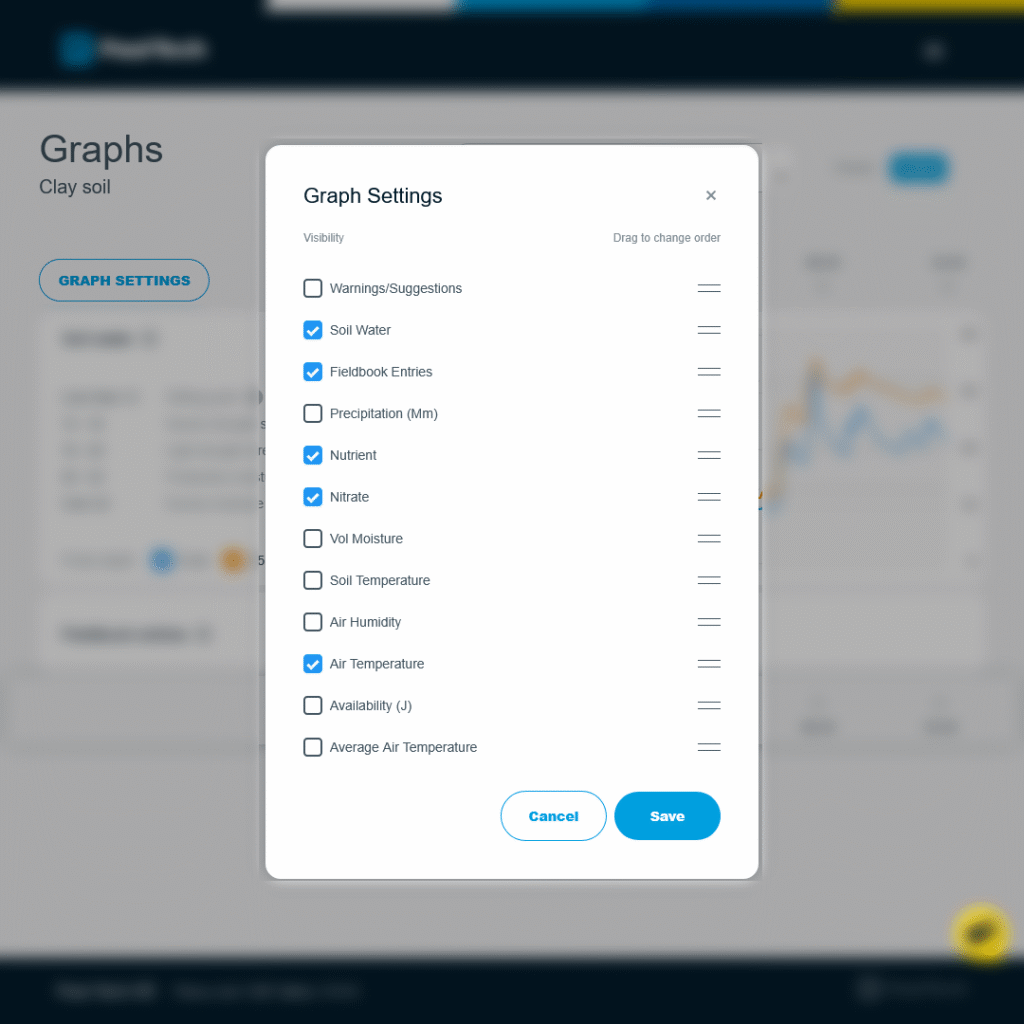
A Clear Overview of Both Soil and Weather
The graphs display data from multiple measurement depths, helping to better understand how changes occur across different soil layers. Often, the impact is not limited to the surface – water, temperature, and nutrients move deeper over time, and this is reflected in the measurements.
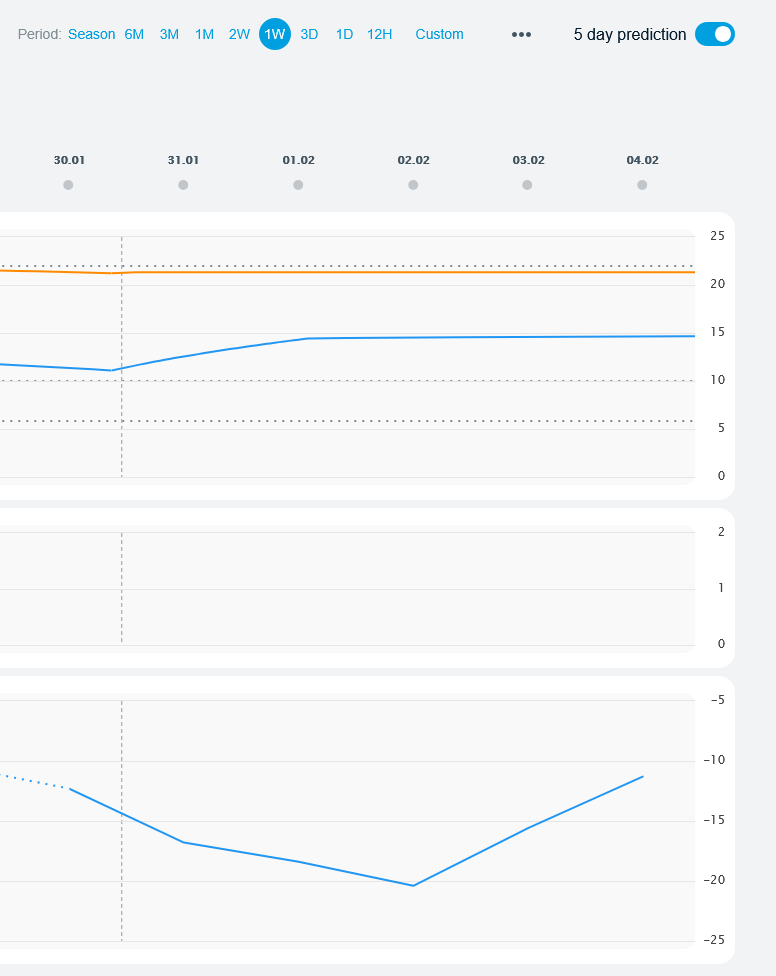
In addition to measured data, the graphs also include a short-term forecast, which does not only describe upcoming weather but also provides an indication of what is likely to happen in the soil.
A 5-Day Forecast That Shows Soil Response, Not Just the Weather
The 5-day forecast added to the graphs gives an indication of how forecasted weather conditions may affect soil conditions in the near future. It is not simply a weather forecast or a direct action recommendation, but a tool that helps to understand possible developments and identify risks early.
The forecast is based on real-time soil data, historical measurement patterns, and reliable weather models. As a result, it shows not only what kind of weather is expected, but also an estimate of how the soil typically responds under similar conditions.
The forecast helps assess, for example:
- whether upcoming rainfall is likely to significantly increase soil water or remain mostly superficial
- whether a drier period may lead to less favourable soil conditions
- whether conditions are likely to remain stable or if the beginning of change can be expected
This kind of view gives farmers time to observe the situation and consider decisions before changes become visible in the crop.
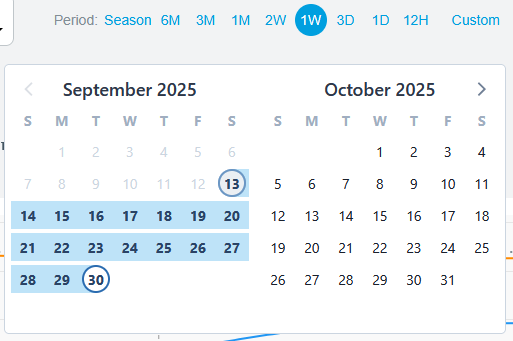
Timeframe Selection Based on Your Needs
Graphs can be viewed over long periods as well as in very detailed time windows. A shorter view allows a closer look at specific changes, while a longer timescale reveals trends and patterns that develop over time.
This flexibility makes it possible to:
- look back and understand what influenced certain outcomes
- track how conditions have evolved over time
- assess whether a parameter is moving towards improvement or deterioration
Why Graphs Offer More Than Just Numbers
The greatest value of the graph view lies not in individual readings, but in making relationships visible. When field operations have been carried out or weather conditions have changed, the graphs allow users to see how and when these changes are actually reflected in the soil.
For example, it may become clear that:
- fertilisation does not lead to immediate change if there is insufficient soil moisture
- after rainfall, nutrient levels may change only after several days
- excessive rainfall moves nutrients deeper into the soil, away from the plant-accessible layer
This retrospective view helps to understand why results turned out the way they did, not just that they did.
Learning How Your Field Behaves
Over time, accumulated graph data helps farmers get to know their field better. When similar situations repeat, patterns can be recognised and it becomes possible to assess how the field has previously responded to weather conditions or field operations.
This knowledge does not force immediate action, but provides confidence that future decisions are based on real experience rather than assumptions.
Summary
The graph view shows how what’s happening in the field develops over time, not just the current situation. It makes visible the relationships between weather, soil, and field operations, helping to understand why changes occur the way they do.
In addition to the current state, the forecast also provides insight into how the soil is likely to respond in the near future – not just what the weather will be.
The result is not more numbers, but a clearer picture of how your field actually behaves – and it is this understanding that forms the foundation for smarter decisions in the future.
Read also: Soil Station vs Weather Station: Key Differences in the Field