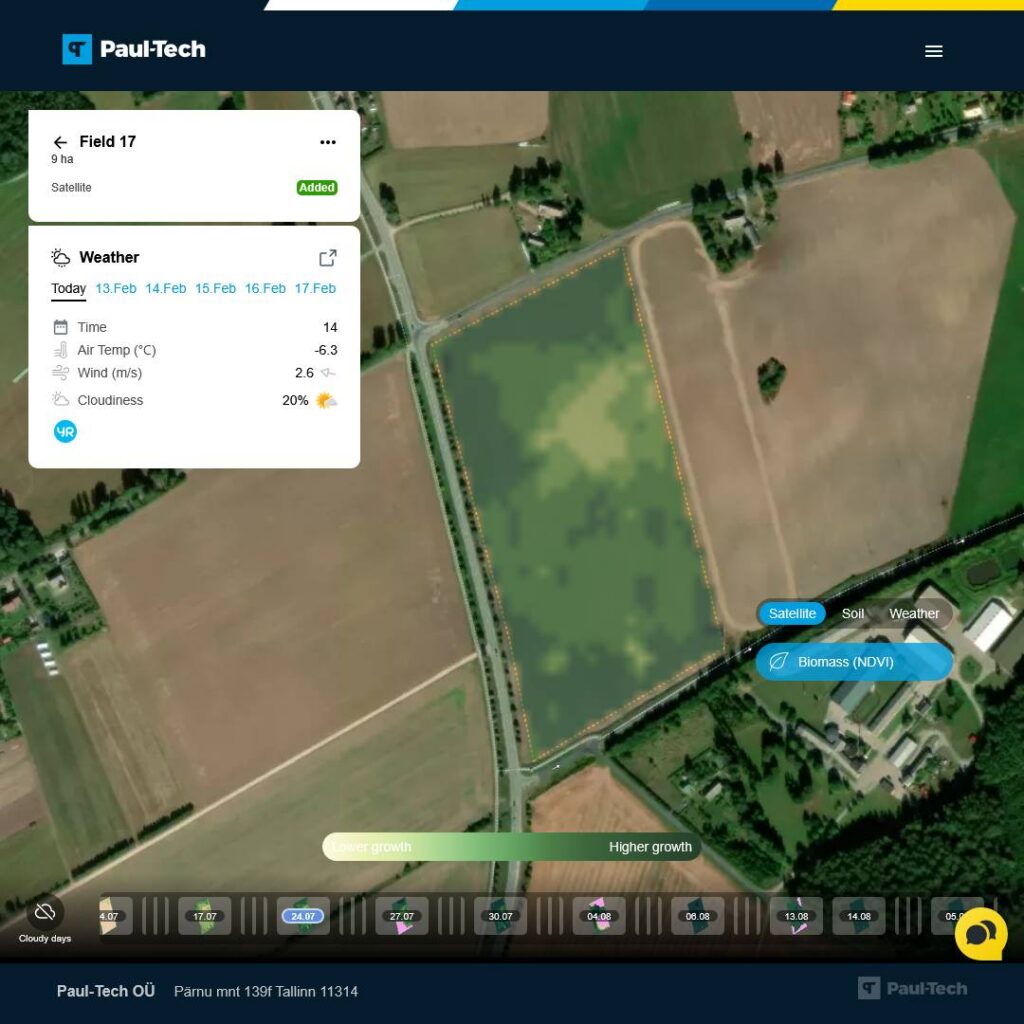
Growing conditions and yield potential can vary significantly across different areas of a field – crop growth is never completely uniform. In the Paul-Tech map view, NDVI satellite imagery allows you to see the condition of the entire field quickly and visually. This enables the grower to assess where crop growth is stronger and where it is weaker, without having to measure each area separately.
What Is NDVI and What Does It Show?
NDVI is a widely used method for assessing crop vigour and growth activity based on satellite data. On the map, crop growth intensity is displayed on a scale from weaker to stronger areas, making field variability immediately visible. It provides a quick overview of yield potential and helps plan fertiliser applications, crop care and other field operations more precisely.
Biomass and Soil Station Data Combined – Answering “Why?”
Satellite imagery shows where crop growth is weaker or stronger, but on its own it does not always explain the reason. Real-time data from the Paul-Tech soil station adds the necessary context.
If NDVI indicates weaker growth, real-time measurements help identify whether the cause is drought stress or nutrient deficiency. If soil moisture and temperature are within optimal ranges, weaker growth is more likely linked to nutrient limitations.
Looking at both data sources together helps avoid ineffective operations and helps target inputs to the areas where they will have real impact.
Early Spring Overview and Correct Timing
Early spring satellite imagery provides a quick overview of how crop cover is developing, highlighting which areas are already active and which still need time or further drying.
This helps identify field differences and decide where fertiliser applications or other operations will genuinely be beneficial. When combined with soil station data, NDVI imagery can be used more effectively — planning inputs where crops are able to take them up and avoiding operations in waterlogged or poorly performing areas.
Monitoring Throughout the Season and Reviewing History
NDVI maps allow growers to monitor field development throughout the growing season and compare it with previous years.
Reviewing earlier seasons helps to understand how weather conditions and field operations have affected crop performance, and to identify patterns — for example, how the field responds to a dry spring, a wet autumn, or operations carried out at certain timings.
This kind of historical view supports more informed decisions for the following season and helps build a deeper understanding of the field, not just its current condition.
Satellite Imagery Does Not Replace Real-Time Data – It Complements It
The core of the Paul-Tech system is real-time soil station measurements. These provide immediate data on soil moisture, temperature and nutrient dynamics — not days or weeks later.
Satellite imagery offers a quick overview of whole-field conditions and patterns that might otherwise go unnoticed.
Summary
NDVI mapping combined with Paul-Tech real-time data provides a comprehensive overview of field condition.
It helps growers better understand their land and yield potential, make more precise and sustainable decisions about input use, and take action where intervention will deliver real benefit.
This tool supports informed and targeted field management throughout the growing season.