Paul-Tech’s precipitation charts show daily precipitation totals and how rainfall is distributed over time. A live weather forecast answers the question, “Is it raining?”, but the chart helps you understand what that rainfall actually means in the field.
The timeline connects rainfall with soil water, nutrient movement, and field operations. It shows why soil conditions can change quickly in some periods, while at other times the impact remains small.
Rainfall does not affect every field in the same way
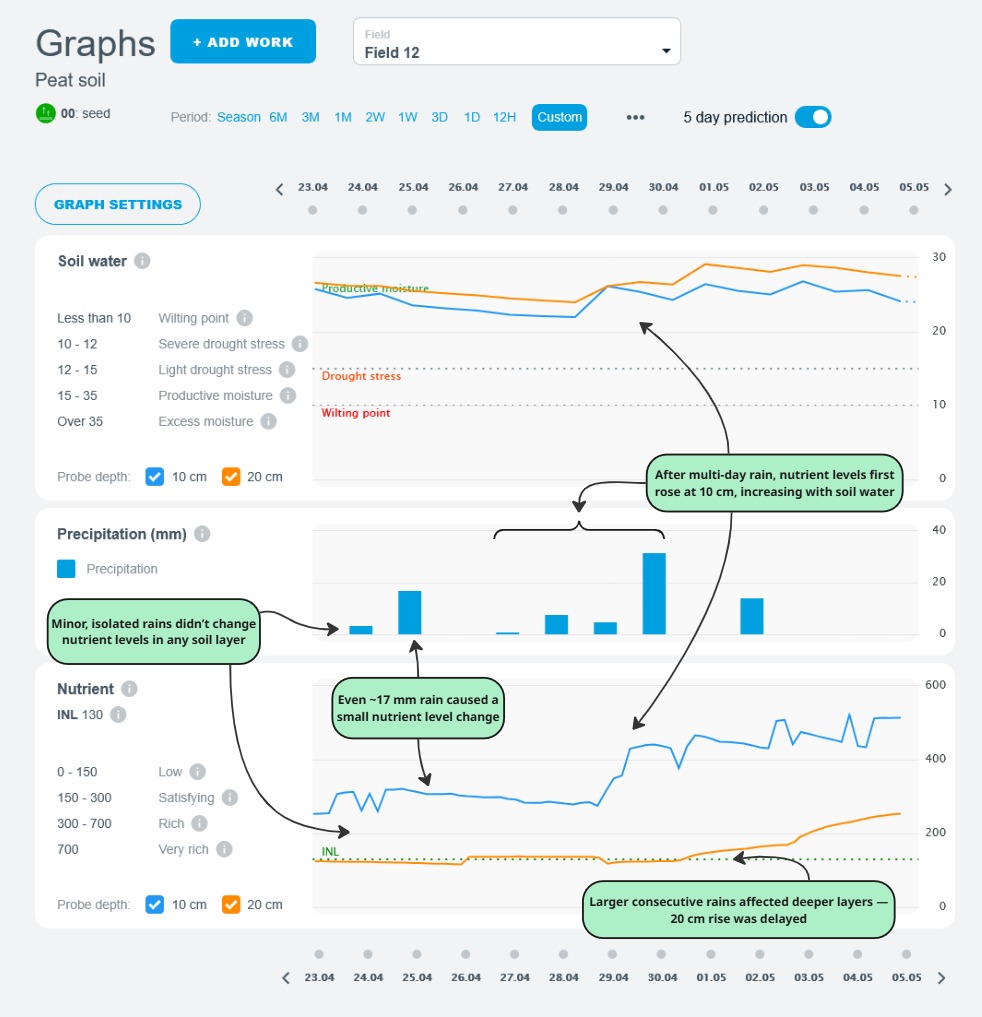
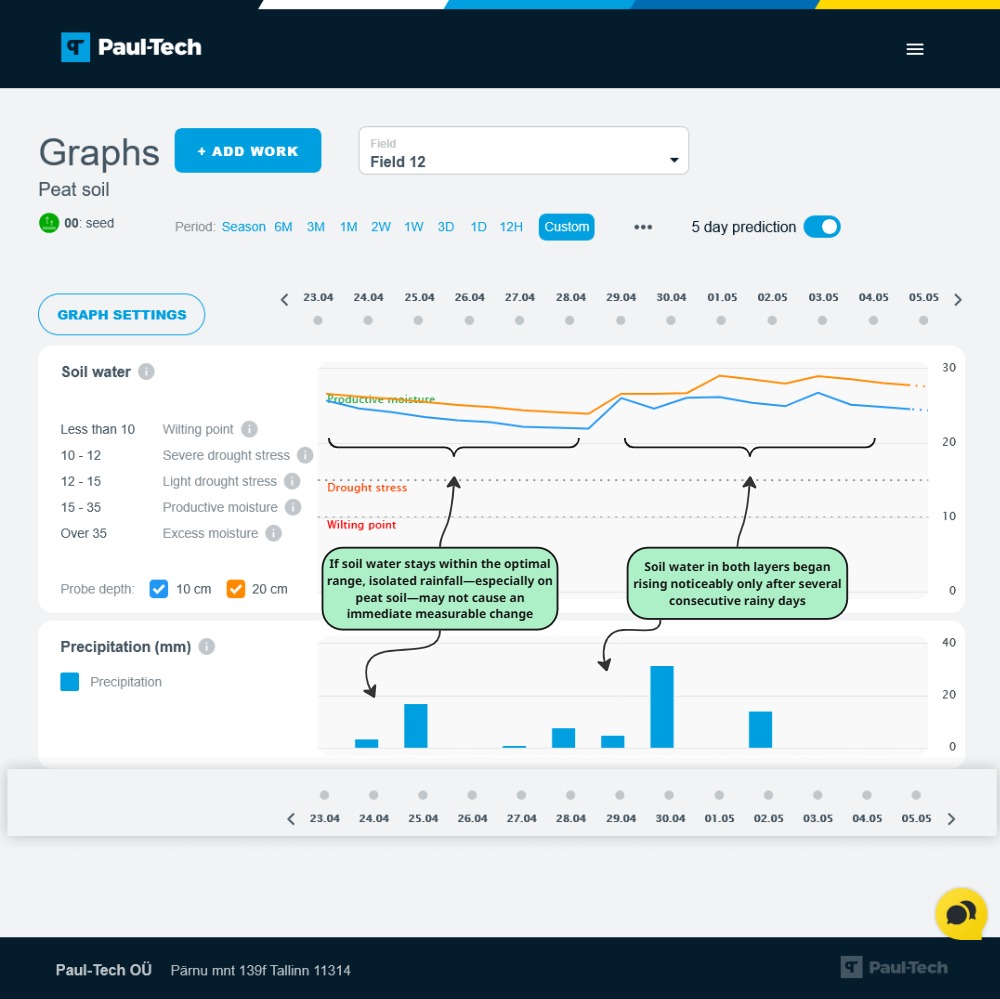
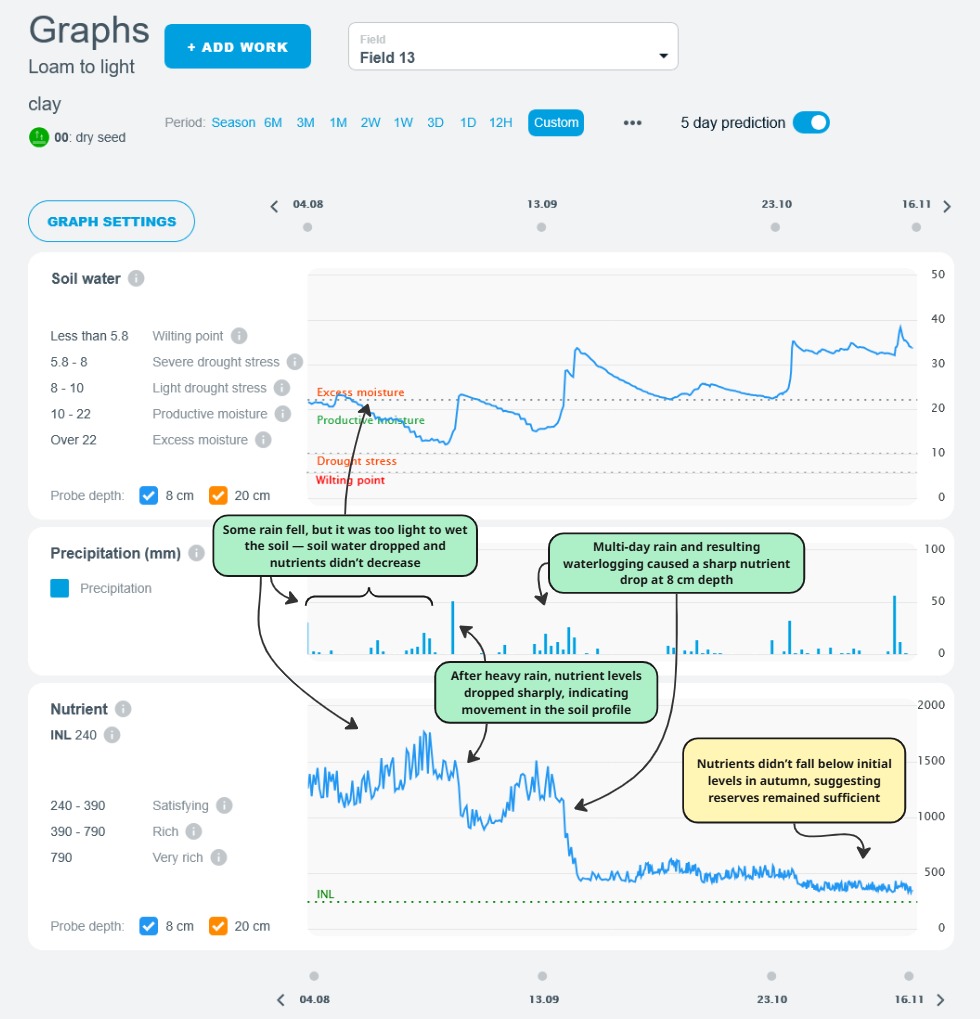
Not all rainfall events have the same impact. In dry soil, a light shower may stay near the surface and may not immediately increase moisture in the root zone. If rain continues for several days, the soil profile gradually refills and moisture reaches deeper layers.
In already wet soil, the same amount of rain can have a very different effect. When the soil is close to saturation, additional rainfall may not improve conditions. Instead, it can increase waterlogging and raise the risk that water — and nutrients — move below the root zone.
The charts help you see when rainfall has an immediate effect and when the response takes more time.
Rainfall, soil water and fertiliser: timing makes the difference
The effect of rainfall depends not only on the total amount, but also on how wet the soil was beforehand. When soil moisture is low, the impact may only become visible after several days of steady rain. When the soil is already wet, each additional rain event can add stress to both the crop and the soil.
Rainfall is also closely linked to fertiliser performance. Moderate rainfall helps move fertiliser into the root zone and supports nutrient uptake. Dry conditions can leave fertiliser temporarily unavailable. During heavy or prolonged rainfall, nutrients may move deeper with water, reducing efficiency and increasing the risk of losses.
Often, the key question is not how much fertiliser was applied, but under what conditions the rain occurred.
Planning field operations and using the time scale
Rainfall also directly affects whether fieldwork can be carried out. Very wet soils reduce trafficability and increase the risk of soil damage when machinery enters the field. Compaction, smearing and rutting can have long-term consequences.
Different time views in the charts help link individual rainy days with changes in soil conditions. They also reveal longer seasonal patterns. Over time, it becomes clearer when the soil reacts quickly, when the response is slower, and when risk periods tend to repeat.
Combined with soil water and nutrient measurements, rainfall becomes more than just a weather event — it becomes something you can monitor and understand.

Summary
Paul-Tech’s precipitation charts do not label rain as “good” or “bad”. They help you understand when and how precipitation affects soil water, nutrient movement, and the timing of field operations.
Together with other measurements, they provide a clearer picture of cause and effect — often before changes become visible in crop condition or yield. This supports calmer, better-informed decisions at the right time.