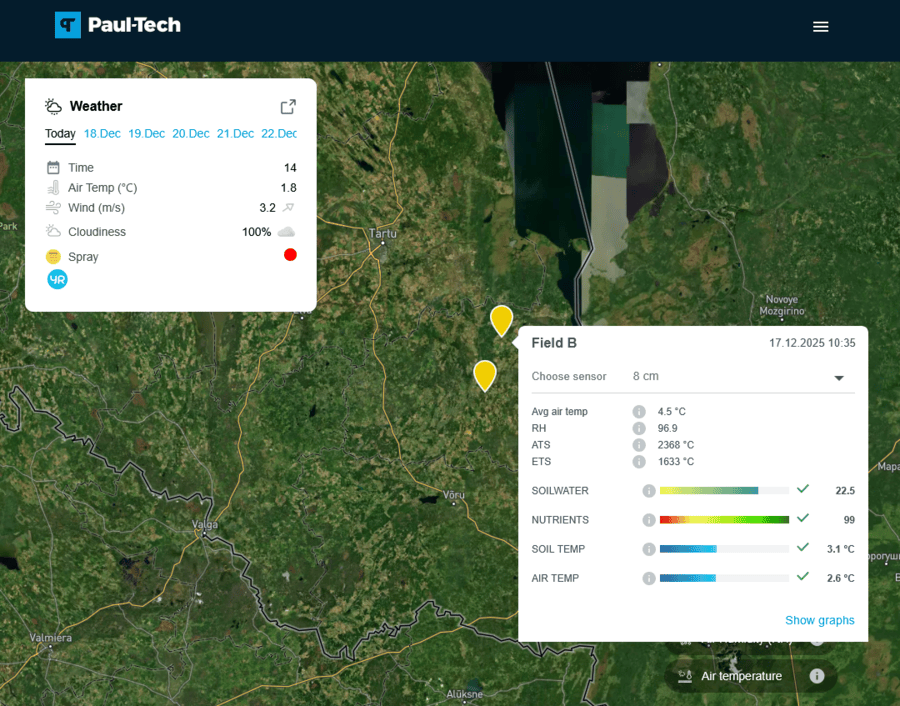
In the map view, each field has its own marker. Clicking on it opens more detailed information about that specific field. This removes the need to rely on general weather forecasts and allows users to see the conditions exactly where the work is being carried out. In the opened view, station-measured data and the weather forecast are displayed separately, together helping to better understand both the current situation and what lies ahead.
Station Data View
The station data view displays the latest measurement results for the field in real time. Data can be viewed by different sensors located at various depths in the soil. This makes it possible to compare conditions in the upper and deeper soil layers and see how they differ from one another.
Key indicators such as air temperature, soil temperature, soil water and nutrient status are shown. The colour scale next to each reading helps to quickly understand whether conditions are within a normal range or require attention, without the need to analyse numbers in detail. This makes complex information easier to understand and helps to better perceive the conditions in which the crop is currently growing.
Weather Forecast View
The weather forecast view provides a quick overview of conditions for the coming days. Key weather data is displayed by date using simple icons, and a spray suitability indicator is shown separately. This combines several factors into a single colour-coded marker: green indicates suitable conditions, orange signals caution, and red shows that spraying is not recommended.
Hovering over the spray suitability indicator displays more detailed information about which factors are influencing the assessment – for example, whether limitations are caused by wind conditions, temperature or soil status. This means the user does not need to combine all indicators manually; the system provides a quick signal on whether to proceed or wait.
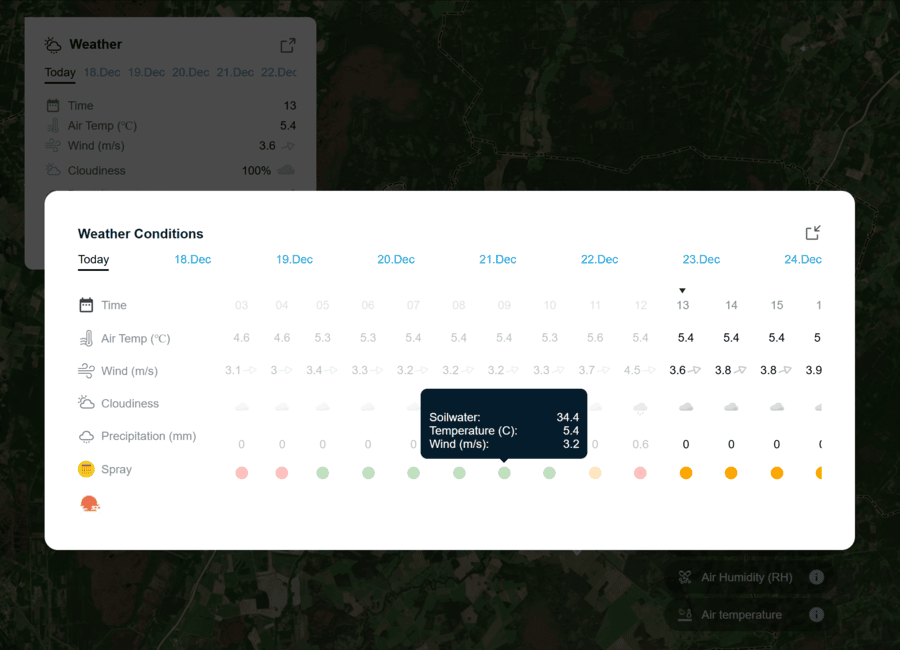
Hourly Weather Forecast
In the expanded view, the weather forecast is presented on an hourly basis. Past and upcoming hours are clearly distinguished, making it easier to understand how conditions change throughout the day. This is important not only for planning field operations, but also for assessing crop condition – for example, when heat stress may occur, when plants recover, and when environmental conditions support or limit growth.
Read also 👉 What Does the Paul-Tech Detailed View Show?