The Paul-Tech detail view presents data for an individual field in an expanded format. It displays the same core indicators as the dashboard view, but with additional explanations, trends and recommendations. This allows you to move beyond a general overview and understand which factors are influencing field and crop conditions at that specific moment.
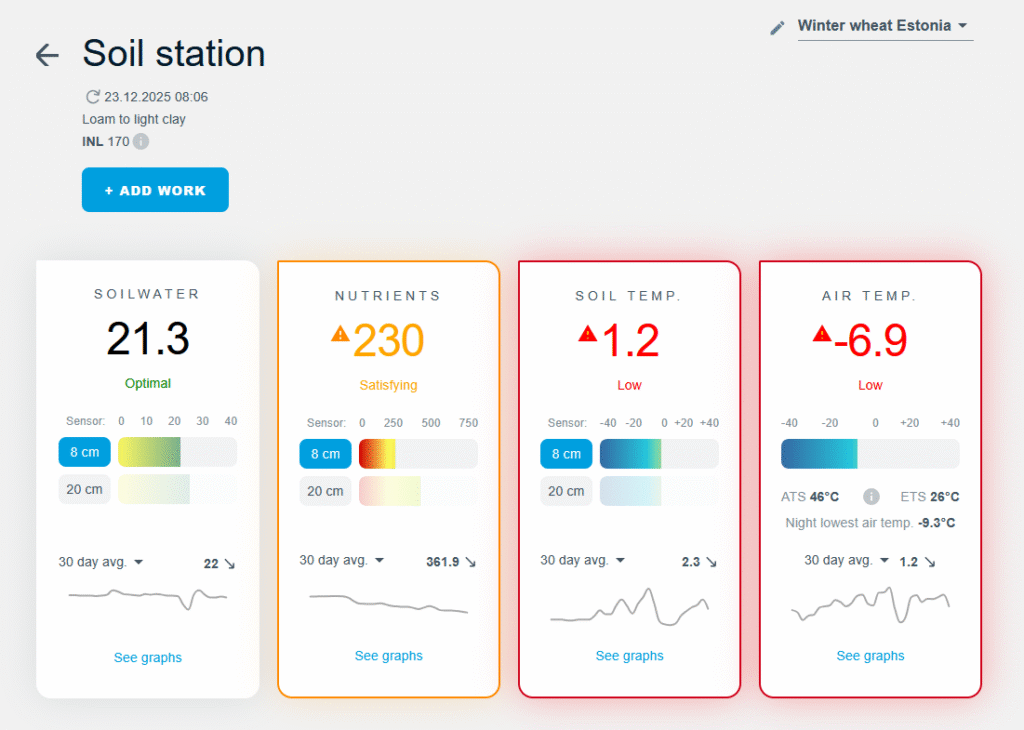
Initial Nutrient Level (INL)
At the top of the detail view, the Initial Nutrient Level (INL) is displayed. This shows the amount of nutrients dissolved in the soil solution in spring, before fertilisation. It provides a starting point for the season and helps assess the condition of the soil before additional fertilisers are applied.
Crop growth stage forecast
Below the Initial Nutrient Level, a crop growth stage forecast is shown. This is based on the sowing date entered in the field record and the measured environmental conditions. It indicates the current development stage of the crop and helps link measured data to actual crop growth — for example, whether conditions are supporting development or potentially slowing it down.
Recommendations and alerts
Next, recommendations and alerts are displayed, forming one of the most important parts of the detail view. These are based on sensor data and how it changes over time, and may indicate issues such as excessive dryness or waterlogging, crop stress, unsuitable temperatures, or favourable conditions for carrying out specific operations.
The purpose of these recommendations is not to issue instructions, but to help avoid situations where decisions are made too late — for example, when crops are already under stress or conditions have become unsuitable. They enable timely responses before impacts on yield or costs occur.
Key environmental indicators for the field
Below the recommendations, the main environmental indicators for the field are shown as separate cards: soil moisture, nutrients, soil temperature and air temperature. Each card provides a quick visual assessment of current conditions. Colour coding makes it easy to see whether values are optimal, acceptable or critical. If a parameter falls outside the normal range, the entire card is highlighted accordingly to ensure it does not go unnoticed.
Data from different soil depths
For soil-related indicators, data can be viewed at different depths. This helps determine whether an issue or favourable condition is limited to the topsoil or extends deeper into the root zone. This is important, as crops often respond most strongly to the soil layer where their roots are actively growing.
Changes over time
In addition to current conditions, the detail view also shows how indicators have changed over recent days. Short trend charts and average values help assess whether conditions are improving, deteriorating or remaining stable. This means decisions do not have to rely on a single measurement, but can be based on the actual direction of change.
Air temperature and crop development
On the air temperature card, alongside current values, temperature sums relevant to crop development and the lowest night-time temperature are also displayed. These help relate measured environmental conditions to crop growth rate and potential stress, without the need for manual calculations.
Weather forecast and spraying suitability
At the bottom of the detail view, an expanded hourly weather forecast table provides an overview of upcoming conditions. Past and future hours are clearly distinguished, and alongside weather data, a spraying suitability indicator is shown — green indicates suitable conditions, yellow suggests caution, and red shows that spraying is not recommended.
This combines several important factors into a single, easy-to-understand signal, allowing quick assessment of when conditions are favourable and when it is better to wait. The weather forecast supports not only task scheduling, but also understanding the conditions in which crops are likely to grow or experience stress in the near future.
Summary
The Paul-Tech dashboard detail view is designed for situations where a deeper level of insight is needed — to understand why the system issues an alert, which factor is driving change, and how this may affect crop development and decision outcomes. It connects real-time data with context and trends, helping support informed, timely decisions throughout the growing season.
Read also 👉 What is the Paul-Tech dashboard view?