The Paul-Tech dashboard is a web-based overview that gives farmers a clear snapshot of the status of all their fields. Its purpose is to bring together the most important real-time soil and weather data in one place, allowing fields to be quickly assessed and compared.
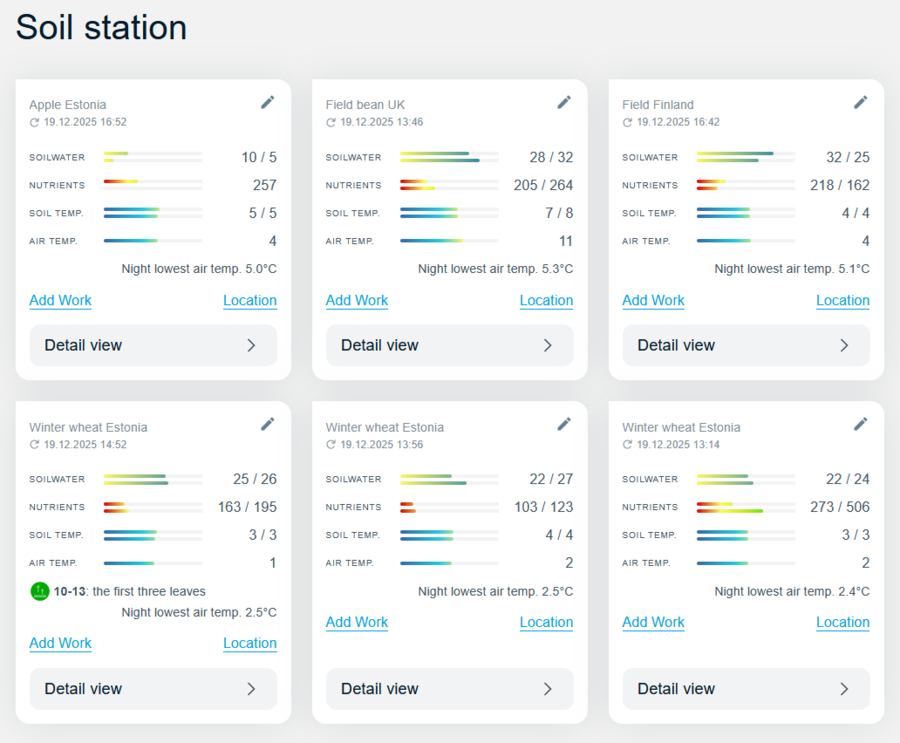
In the dashboard, each field is displayed as a separate card. At the top of the card, the field name is shown, followed by key parameters measured in real time by the Paul-Tech soil station: soil water availability, nutrient levels, soil temperature, and air temperature. Soil parameters are presented at two different depths, helping farmers better understand where the crop root zone is located and which soil layers influence plant growth and nutrient uptake at different growth stages.
To make data interpretation fast and intuitive, each parameter is supported by a visual colour scale. This provides an immediate indication of whether conditions are favourable for crop growth or whether a limiting factor may be emerging. Thanks to this visual approach, important changes in field conditions can be identified quickly, without the need to analyse individual numbers in detail.
In addition to current conditions, the dashboard also displays the lowest air temperature recorded overnight. This helps farmers assess whether crops may have experienced temperature-related stress during the night—such as from cool conditions—and whether this could affect growth, development, or recovery the following day.
Each field card also includes a crop growth stage forecast. This is based on the sowing date entered in the field diary and the environmental conditions measured by Paul-Tech. Growth stage information helps link real-time soil and weather data with the actual development stage of the crop, supporting more informed decision-making throughout the growing season.
In summary, the Paul-Tech dashboard is designed primarily for quick assessment and comparison between fields. It helps farmers identify fields that require closer attention at an early stage and, when needed, guides them to the detailed view, where more in-depth data and time-based trends can be explored.