The Recommendations and Alerts layer in Paul-Tech’s graph view gives your data clear meaning. It shows what conditions really existed in the field and whether they supported the work being done.
Alerts appear as icons on the timeline. Clicking an icon opens a detailed explanation. Key information is visible both on the dedicated recommendations chart and along the top of other charts—right where you are analysing the data.
Linking fieldwork to actual conditions
Paul-Tech recommendations help connect the work you do to the real field conditions.
For example, after spreading fertiliser, the charts can show:
- when the fertiliser dissolved,
- when nutrients became available to the plants,
- whether conditions supported nutrient uptake or limited it.
This way, results are not judged only by final yield—you can see how weather and soil conditions influenced the outcome.

Weather and crop stress alerts
The system also highlights situations where fieldwork may not be advisable or needs reconsidering, for example:
- wind too strong for spraying,
- frost risk or low night-time temperatures,
- heat stress,
- moisture stress or early drought conditions.
At the same time, it confirms when conditions are suitable—for example, when soil moisture, temperature, and wind speed are all within the optimal range.

Multiple factors considered
Paul-Tech recommendations are never based on just one factor. They take into account several things at once: air temperature, soil moisture, wind, recent temperature changes, and other key environmental factors.
A suitable air temperature alone does not mean the work will be effective. A recommendation appears only when overall conditions support successful results.
This helps avoid situations where one parameter looks good, but the actual effect is lower than expected.
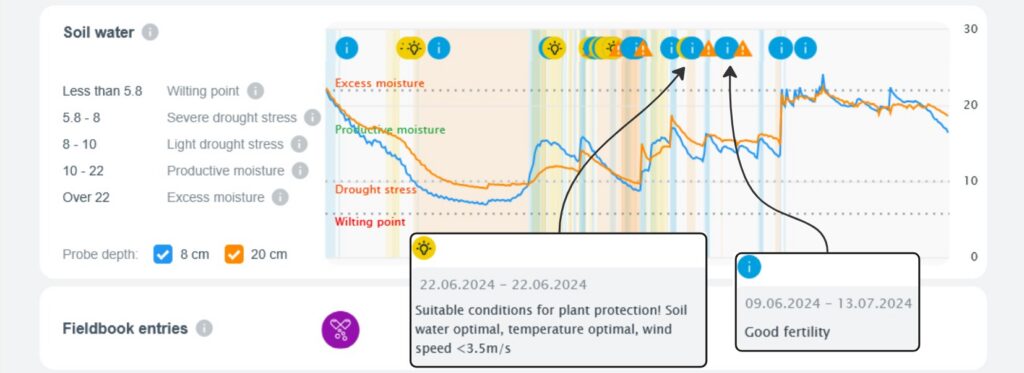
Understanding your charts
Paul-Tech charts show changes over time. Alerts help interpret what these changes mean in practical terms.
For example, they show:
- when rainfall reached different soil depths,
- when the soil starts drying quickly,
- when biological activity in the soil increases,
- when conditions become stressful for the crop.
Alerts act as time markers, explaining why a change happened on the chart.

A complete overview
All alerts are collected in a dedicated chart summarising key events over the chosen period. The same information is also available in the detailed field view, ensuring that critical moments are never missed.
Important: Recommendations and alerts do not make decisions for you. Their value is in showing exactly when conditions support fieldwork and when it might be wise to reconsider your plans.