Air temperature is one of the most important and at the same time most variable factors influencing daily conditions in the field. It directly determines whether a crop begins to grow, pauses its development, experiences stress, or is at risk of frost damage. Paul-Tech’s air temperature map combines real-time measurements from stations located across Estonia, providing a quick overview of conditions in different regions and helping to better time field operations.
A Regional Overview
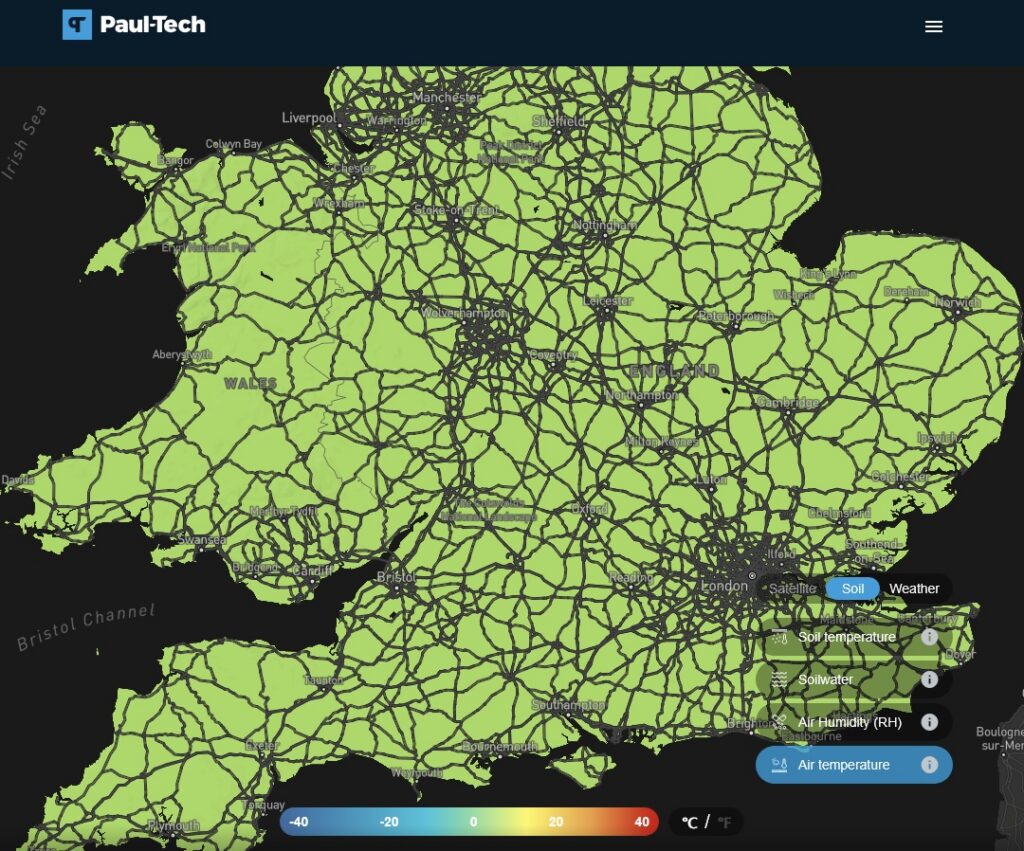
The air temperature map is not designed for detailed assessment of a single field. Its strength lies in providing a broader regional picture. The map allows users to quickly see which areas are warmer, where colder conditions persist, and where temperatures may be approaching critical thresholds.
Unlike conventional weather stations that measure temperature at a height of 2 metres, Paul-Tech sensors are positioned at crop canopy height. This provides a more accurate picture of the conditions in which crops actually grow. The timeline helps to understand whether a region is moving towards warming, cooling, or stable weather conditions.
Important Information Throughout the Growing Season
Air temperature is important both at the start of the growing season and during summer. In spring, the map provides a quick indication of when there may be a risk of frost or when conditions are warm enough to begin drilling and other field operations.
In summer, the temperature map helps identify areas where heat may start to cause stress to crops and increase water evaporation from soil and vegetation. Comparing regions helps to better understand which fields dry out more quickly and which do so more slowly.
The Link Between Field Operations and Crop Development
For most arable crops, a favourable air temperature range for growth is approximately 10–20 °C, which can be clearly monitored across regions using the map. This information helps assess whether conditions are suitable for field operations such as fertiliser application or spraying.
When temperatures rise above this range, active ingredients used in spraying may evaporate more quickly, making applications less effective. The temperature map also provides an indication of when heat may begin to affect flowering and grain or fruit formation, especially when high temperatures persist for several consecutive days.
Useful Information During the Winter Period
During winter, the air temperature map provides valuable information about cold periods, thaws and rapid temperature fluctuations. Snow cover persistence can often be assessed based on regional temperature differences.
In areas where temperatures remain lower, snow is more likely to stay on the ground longer and provide protection for crops. In regions where temperatures fluctuate around zero, frequent freeze–thaw cycles occur, which can affect both soil conditions and crop winter hardiness. This information helps determine which fields should be inspected first in spring to assess potential damage.
Read also 👉 Why Is Measuring Soil Temperature Important?