
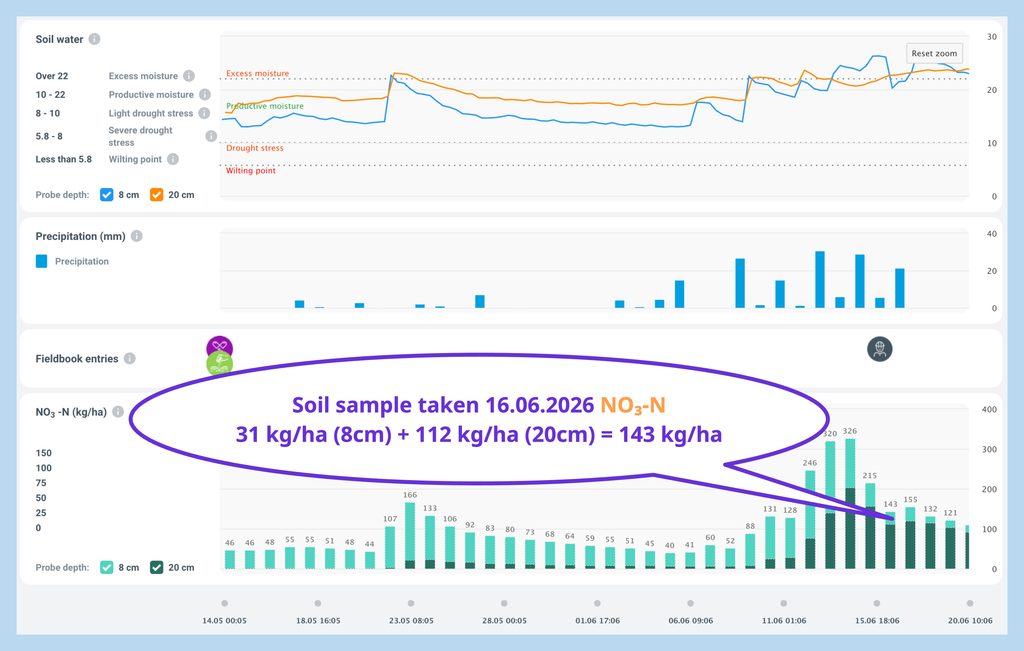
In mid-June, Kaarli Agro contacted us because nitrate nitrogen levels had risen very quickly in the Paul-Tech system at two of their fields — Veski and Oonurme.
The customer’s question was completely reasonable: fertiliser had already been applied in early and mid-May, and there had been no further fertilisation in June. So where did all that nitrogen come from? And were the unusually high readings actually real?
Rather than only explaining the change from the data, we decided to verify it with independent laboratory analysis.
The change happened within just a few days
At the beginning of June, the soil was warm and relatively dry. At Oonurme, soil temperature at 8 cm depth rose above 20°C.
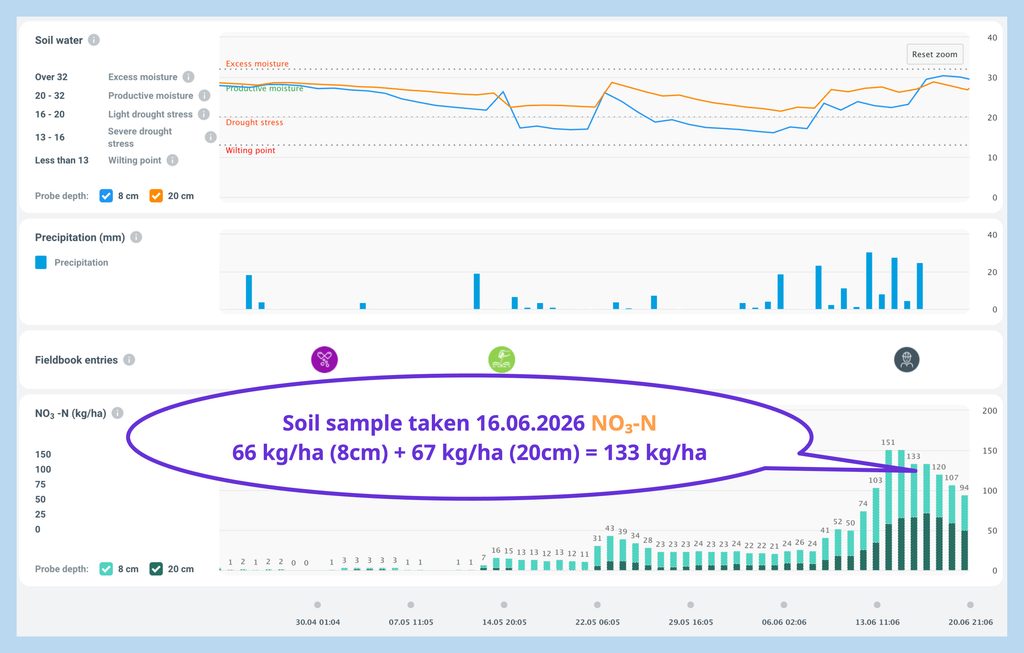
Then the weather changed sharply. Between 3 and 15 June, both fields received close to 135 mm of rainfall.
At the same time, nitrate nitrogen levels in the soil began to change rapidly.
On 8 June, the Paul-Tech system showed approximately 16 kg/ha of NO₃-N at 8 cm depth in the Veski field. A few days later, the reading had risen to 93 kg/ha.
At Oonurme, the increase was even greater: from approximately 46 kg/ha to 180 kg/ha.
It was exactly this sudden increase that made the customer question whether something might be wrong with the measurement.
We checked the readings with an independent laboratory
On 16 June, we took soil samples directly beside the Paul-Tech sensors in both fields.
Samples were taken from both 8 cm and 20 cm depths — corresponding to the sensor measurement depths — and sent to the METK laboratory for NO₃-N analysis.
The laboratory and Paul-Tech report their results in different units. The laboratory reports NO₃-N concentration in milligrams per kilogram of soil, while Paul-Tech estimates the amount of available nitrate nitrogen in kilograms per hectare within the corresponding soil layer.
This means the figures cannot be compared directly. However, once the laboratory results are converted to kg/ha for the same soil layer, the comparison becomes very clear:
| Sampling location | METK laboratory, NO₃-N converted to kg/ha | Paul-Tech, kg/ha |
|---|---|---|
| Veski, 8 cm | 77 | 66 |
| Veski, 20 cm | 82 | 67 |
| Oonurme, 8 cm | 50 | 31 |
| Oonurme, 20 cm | 124 | 112 |
The results are naturally not identical. These are two different measurement methods, and soil itself is never completely homogeneous.
What matters is that the laboratory and Paul-Tech showed the same overall picture, and the NO₃-N levels were within a comparable range. In three of the four measurement points, the results were relatively close. The ranking of the four samples was also the same with both methods.
We could therefore answer the customer’s first question:
Yes — the high nitrate readings were real.
But where did the nitrogen come from?
The increase in June could not be explained by a new fertiliser application, because no additional fertiliser had been applied.
The data indicates that a significant part of the nitrate nitrogen was released from the soil itself.
Soil organic matter contains a considerable amount of nitrogen, but plants cannot use most of it directly. Soil microorganisms gradually convert part of this organically bound nitrogen into plant-available forms through a process known as mineralisation.
The speed of this process depends strongly on soil temperature and moisture.
When warm, dry soil suddenly receives a large amount of water, microbial activity can increase rapidly. As a result, a significant amount of plant-available nitrogen may be released within a relatively short period.
That is exactly the type of situation we saw in the first half of June: warm soil followed by heavy rainfall coincided with a rapid increase in NO₃-N.
The rain did not bring new nitrogen into the field. Instead, it helped release nitrogen that was already present in the soil and make it available to plants.
A single soil sample or continuous monitoring?
Laboratory soil analysis is an extremely valuable reference point. It gives a reliable picture of what was present in the soil at the moment the sample was taken.
But conditions in the field change continuously.
Rainfall, drying of the soil, temperature, fertiliser dissolution, crop uptake and biological processes in the soil can all change nitrate availability within days.
If we had taken the soil samples one week earlier or one week later, the results could have been very different.
This is where continuous monitoring becomes particularly valuable.
A soil sample provides a strong reference point. Continuous measurement shows what happens between those reference points.
In this case, we could see when nitrate levels started to rise, how quickly they changed and how the change coincided with rainfall and soil moisture.
We could then use the laboratory samples to independently check whether the magnitude shown by the sensors reflected the actual situation in the soil.
It did.
Why does this matter for farmers?
When making nitrogen management decisions, it is not enough to know how much fertiliser has been applied.
It is equally important to understand when that nitrogen becomes available to the crop and how much plant-available nitrogen is already present in the soil.
That is what continuous soil monitoring helps reveal.
Sometimes the system confirms exactly what the farmer or agronomist expects.
Sometimes — as in this case — the soil tells a very different story.
And that is exactly when real-time measurement becomes most valuable.